

| Tests |
| Player\Statistics |
Runs |
Average |
Best |
100s |
50s |
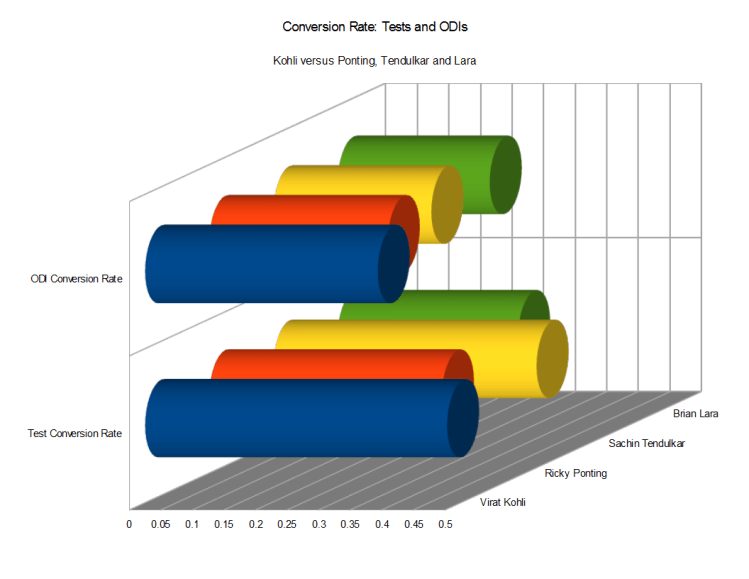
Conversion Rate |
| Virat Kohli |
2994 |
44.02 |
169 |
11 |
12 |
.48 |
| Ricky Ponting |
2481 |
44.3 |
197 |
7 |
12 |
.37 |
| Sachin Tendulkar |
2911 |
54.92 |
179 |
10 |
14 |
.42 |
| Brian Lara |
3751 |
55.16 |
375 |
8 |
20 |
.29 |
|
|
|
|
|
|
|
| ODIs |
| Player\Statistics |
Runs |
Average |
Strike Rate |
100s |
50s |
Conversion Rate |
| Virat Kohli |
7212 |
51.51 |
89.97 |
7 |
12 |
.37 |
| Ricky Ponting |
6143 |
42.37 |
77.56 |
13 |
33 |
.28 |
| Sachin Tendulkar |
5828 |
38.85 |
82.58 |
12 |
36 |
.25 |
| Brian Lara |
6433 |
42.32 |
79.12 |
13 |
41 |
.24 |
Source:http://www.livemint.com/Leisure/zFN5uZLt2L57BBh01TH2AI/Kohli-and-crickets-modern-greats.html
19.075984
72.877656
Mumbai, Maharashtra, India
Related
About LINUS FERNANDES
I have been an IT professional with over 12 years professional experience. I'm a B.Sc. in Statistics, M.Sc in Computer Science (University of Mumbai) and an MBA from the Cyprus International Institute of Management. I have completed levels I and II of the CFA course. Blogging is a part-time vocation.
I am also the author of four books, Those Glory Days: Cricket World Cup 2011, IPL Vignettes, Poems: An Anthology, and It's a Petting Sport---all available on Amazon Worldwide.

Discussion
Comments are closed.